
Report On the State
of the Environment In China
2 0 0 3
Atmospheric Environment
![]() General Situation
General Situation
In general, the air quality of cities across the country improved. Among the 340 cities
monitored, 142 cities (41.7% of all cities monitored, or 7.9 percentage points more than the
previous year) attained national Grade II standard for ambient air quality; 107 cities (31.5% of
all cities monitored, or 3.5 percentage points fewer than the previous year) attained Grade III
standard; and 91 cities (26.8% of all cities monitored, or 4.4 percentage points fewer than the
previous year) had air quality of lower than Grade III.
36.4% of all urban population lived in cities that attained Grade II air quality. This was a 10.3% increase over the previous year.
Big cities were generally more polluted than medium and small cities. The percentage of cities with more than 1 million people that attained Grade II standard was low.
Percentage of Cities Attaining Different Levels of Air Quality Standards
(%)
Percentage of Cities Having Different Levels of Particle Concentrations
|
Percentage of cities Level of concentration |
Year 2002 | Year 2003 |
| Grade II (attaining required standard) | 36.5 | 45.6 |
| Grade III | 33.7 | 33.2 |
| Grade IV | 29.8 | 21.2 |
Percentage of Total Urban Population Living Under Different Levels of Air Quality
| Year | 2002 | 2003 |
| Attaining Grade II | 33.8 | 41.7 |
| Attaining Grade III | 35.0 | 31.5 |
| Worse than Grade III | 31.2 | 26.8 |
Percentage of Cities Attaining Different Levels of Air Quality Standards (%)
Main Pollutants in the Air: The main pollutant that affects air quality was still particles. 54.4% of all cities monitored had particle concentrations exceeding Grade II standard. Among the cities whose air quality was worse than Grade III, 80% had particle concentrations exceeding Grade III standard. Cities with high particle concentrations were mostly found in the northwest, the north, and the central part of China, and the east of Sichuan.
Compared with the previous year, the percentage of cities with particle concentrations attaining Grade II standard had increased by 9.1%, and the percentage of cities with particle concentrations attaining Grade III standard had dropped by 8.6%.
25.6% of all the cities monitored had SO2 concentrations exceeding Grade II standard. Compared with last year, the percentage of cities with SO2 concentrations exceeding Grade III standard had increased by 3.6%. Cities with high SO2 concentrations were mostly found in Shanxi, Hebei, Henan, Hunan, Inner Mongolia, Shannxi, Gansu, Guizhou, Sichuan, and Chongqing.
All cities monitored attained Grade II standard for NO2 concentrations, but Beijing and Guangzhou had relatively high NO2 concentrations.
The Air Quality of Key Cities: Among the 113 key cities for air pollution prevention and control, 37 cities (32.7%) attained Grade II air quality standard, 40 cities (35.4%) attained Grade III standard, and 36 cities (31.9%) had air quality worse than Grade III.
Among the 47 key cities for environmental protection, 24 cities (51.1%) attained Grade II air quality standard, 16 cities (34%) attained Grade III standard, and 7 cities (14.9%) had air quality worse than Grade III. Compared with the previous year, the number of cities attaining Grade II air quality standard had increased by 6, and the number of cities with air quality worse than Grade III had reduced by 4.
Percentage of Cities Attaining Different Levels of
Air Quality Standards for Particle Concentrations
Percentage of Cities Attaining Different Levels of Air Quality Standards for SO2 Concentrations (%)
| Percent of Cities Level of Concentration |
Year 2002 | Year 2003 |
| Attaining Grade II | 77.6 | 74.4 |
| Grade III | 13.9 | 13.5 |
| Worse than Grade III | 8.5 | 12.1 |
| National Average (mg/m3) | 0.043 | 0.049 |
| Air Quality Standard for General Residential Areas (Annual Average Value of Grade II Standards) | 0.06 mg/m3 | |
Percentage of Cities Attaining Different Levels of
Air Quality Standards for so2 Concentrations
Percentage of the 113 "Key Cities for Air Pollution Prevention and Control
"Attaining Different Levels of Air Quality Standard

Number of the 47 Key Environmental Protection Cities Attaining
Different Levels of Air Quality Standard
Number of Key Cities Attaining Different Levels of Air quality Standard
| Level of Air Quality | Of the 113 Key Cities for Air Pollution Prevention and Control | Of the 47 Key Environmental Protection Cities | ||
| 2002 | 2003 | 2002 | 2003 | |
| No. of Cities Attaining Grade II Air Quality Standard | 30 | 37 | 18 | 24 |
| No. of Cities Attaining Grade III Air Quality Standard | 44 | 40 | 18 | 16 |
| No. of Cities with Air Quality Worse than Grade III | 39 | 36 | 11 | 7 |
SO2 Pollution in the "Two Controlled Zones": Among the 340 cities monitored, 64 cities were located within the SO2 Controlled Zones. Among them, 39.1% had SO2 concentrations attaining Grade II standard, and 35.9% (which was 7.8% higher than the previous year) had SO2 concentrations exceeding Grade III standard. 116 cities were located in Acid Rain Controlled Zones. Among them, 75% (which was 4.5% lower than the previous year) had SO2 concentrations attaining Grade II standard, and 2.7% more cities than the previous year had SO2 concentrations exceeding Grade III standard. SO2 pollution in the Two Controlled Zones had been aggravated to some extent.
Comparison of Comprehensive Air Pollution Index of 47 Key Environmental Protection
Cities
SO2 Pollution in the "Two Controlled Zones"
| SO2 Controlled Zones | Acid Rain Controlled Zones | |||
| 2002 | 2003 | 2002 | 2003 | |
|
Percent of cities attaining Grade II standard for SO2 concentration (SO2 <=0.06 mg/m3) |
40.6 | 39.1 | 79.5 | 75.0 |
|
Percent of cities attaining Grade III standard for SO2 concentration (0.06mg/m3<SO2<= 0.10 mg/m3) |
31.3 | 25.0 | 13.7 | 14.7 |
|
Percent of cities with SO2 concentrations of worse than Grade III (SO2 >0.10 mg/m3 ) |
28.1 | 35.9 | 6.8 | 10.3 |
Acid Rain: Monitoring results of precipitation in 487 cities showed that the average pH value of precipitation in 2003 was between 3.67 (which was the value for Pingxiang of Jiangxi Province) and 8.4 (which was the value for Jiayuguan of Gansu Province). Acid rain happened in 265 cities, which was 54.4% of all cities monitored. The
number of cities with pH value not exceeding 5.6 annually on average was 182, which was 37.4% of all cities monitored. 138 cities (or 28.4% of all cities monitored) had acid rain frequency of greater than 40%.
Compared with the previous year, the percentage of cities that had acid rains had increased by 4.1 percentage point; the percentage of cities whose annual average pH value of precipitation was no greater than 5.6 had increased by 4.7 percentage point, the percentage of cities whose annual average pH value of precipitation was no greater than 4.5 had increased by 2.8 percentage point; and the percentage of cities that had acid rain frequency of greater than 40% had increased by 7.2 percentage point. Acid rain pollution was more serious than the previous year.
The distribution of acid rain areas was generally stable. In 2003, the cities with average precipitation pH value of less than 5.6 were mostly found in eastern, southern, central, and southwestern China. Pollution in the Central China Acid Rain Controlled Zone and the Southwestern China Acid Rain Controlled Zone was relatively more serious, and the percentage of cities with average pH value of no greater than 5.6 exceeded 50% in both zones. Hunan and Jiangxi had the most serious acid rain pollution in the Central China Acid Rain Controlled Zone and the Eastern China Acid Rain Controlled Zone respectively. In the Southwestern Acid Rain Controlled Zone, Guizhou was among the most polluted. Zhejiang was the most seriously polluted province in the Central China Acid Rain Controlled Zone. Among northern cities, Shizuishan of Ningxia, Weinan and Shangluo of Shannxi, Dandong, Fuxin, and Tieling of Liaoning, and Tumen of Jilin all had pH value of less than 5.6 in the precipitation.
Percentage of Cities with Different Acidity of Precipitation
Percentage of Cities with Different Frequency of Acid Rain Occurrence
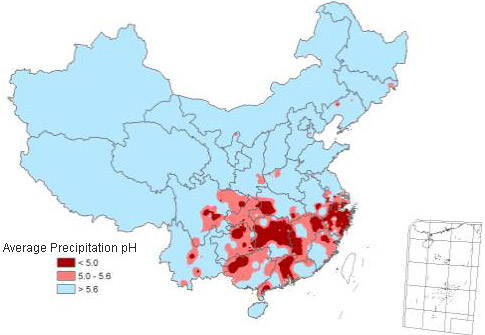
Sketch Map of Regional Distribution of Acid Rain in China in 2003
Percentage of Cities with Different Acidity of Precipitation in Acid Rain Controlled Zones
Percentage of Cities with Different Frequencies of Acid Rain Occurrence
in Acid Rain Controlled Zones
Acid Rain Controlled Zones: For the 106 cities monitored in Acid Rain Controlled Zones, the average pH value of precipitation was between 3.67 (Pingxiang of Jiangxi Province) and 7.30
(Kaiyuan of Yunnan Province). Among them, 95 cities (89.6%) had acid rains. 53.7% of the cities had acid rain frequency of greater than 40%, which was 6.9 percentage point more than the previous year. Huaihua and Jishou of Hunan Province, Wenzhou of Zhejiang Province, and Fuzhou of Jiangxi Province had acid rain frequency of greater than 95%. In particular, the acid rain
frequency in Fuzhou was 100%. Among all the cities monitored, 75 cities (70.8%, or 1.8% fewer than the previous year) had pH value of no greater than 5.6. 48.1% (which was 5 percentage point higher than the previous year) of the cities monitored had pH value of less than 5.0. Pingxiang of Jiangxi Province, Yibin of Sichuan Province, and Jishou of Hunan Province had pH value of lower than 4.0.
The affected area of acid rain in the Acid Rain Controlled Zones was relatively stable, but acid rain pollution had been aggravated in certain areas.
Emission of Air Pollutants in Waste Gases:
In 2003, the total amount of SO2 discharged into the atmosphere was 21.587 million tons, among which 17.915 million tons were from industrial sources, and 3.673 million tons were from household sources. The amount of soot discharged was 10.487 million tons, among which 8.462 million tons were from industrial chimneys, and 2.025 million tons were from household sources. The total amount of industrial dust emitted was 10.21 million
tons.
Emission of Main Air Pollutants from Waste Gases in Recent Years (in 10,000 tons)
| Year | Emission of SO2 | Emission of Soot | Emission of Industrial dust | ||||
| Total | Industrial Sources | Household Sources | Total | Industrial Sources | Household Sources | ||
| 1999 | 1857.5 | 1460.1 | 397.4 | 1159.0 | 953.4 | 205.6 | 1175.3 |
| 2000 | 1995.1 | 1612.5 | 382.6 | 1165.4 | 953.3 | 212.1 | 1092.0 |
| 2001 | 1947.8 | 1566.6 | 381.2 | 1069.8 | 851.9 | 217.9 | 990.6 |
| 2002 | 1926.6 | 1562.0 | 364.6 | 1012.7 | 804.2 | 208.5 | 941.0 |
| 2003 | 2158.7 | 1791.4 | 367.3 | 1048.7 | 846.2 | 202.5 | 1021.0 |
| Annual Change (%) | 12 | 14.7 | 0.6 | 3.5 | 5.2 | -2.9 | 8.5 |
![]() Countermeasures and Actions:
Countermeasures and Actions:
The Prevention and Control of SO2 Pollution in Coal Fired Power Plants: As approved by the State Council, the State Environmental Protection Administration and the State Development and Reform Commission jointly issued The Circular on Strengthening the Prevention and Control of SO2 Pollution in Coal Fired Power Plants, and finished pilot projects on SO2 emissions trading in
Henan, Shanxi, Shandong, Shanghai, Tianjin, and Liuzhou.
The Strengthening of the Prevention and Control of Emissions by Vehicles: The State Environmental Protection Administration continued to exercise authority in granting approval for new vehicle models, and started to set up the second set of emission standards for heavy-duty vehicles. SEPA also carried out sample inspections on vehicle manufacturers and engine manufacturers, and established the mechanism of carrying out periodic emission
inspections for vehicles that are in use.
The air quality of Beijing had been improved: The city of Beijing had achieved the air pollution prevention and control objectives of the "9th Phase" ahead of time. The air quality had turned from "worse than Grade III" to "Grade III". The objective that at least 60% of the days in Beijing should have Grade II or better air quality had been achieved.